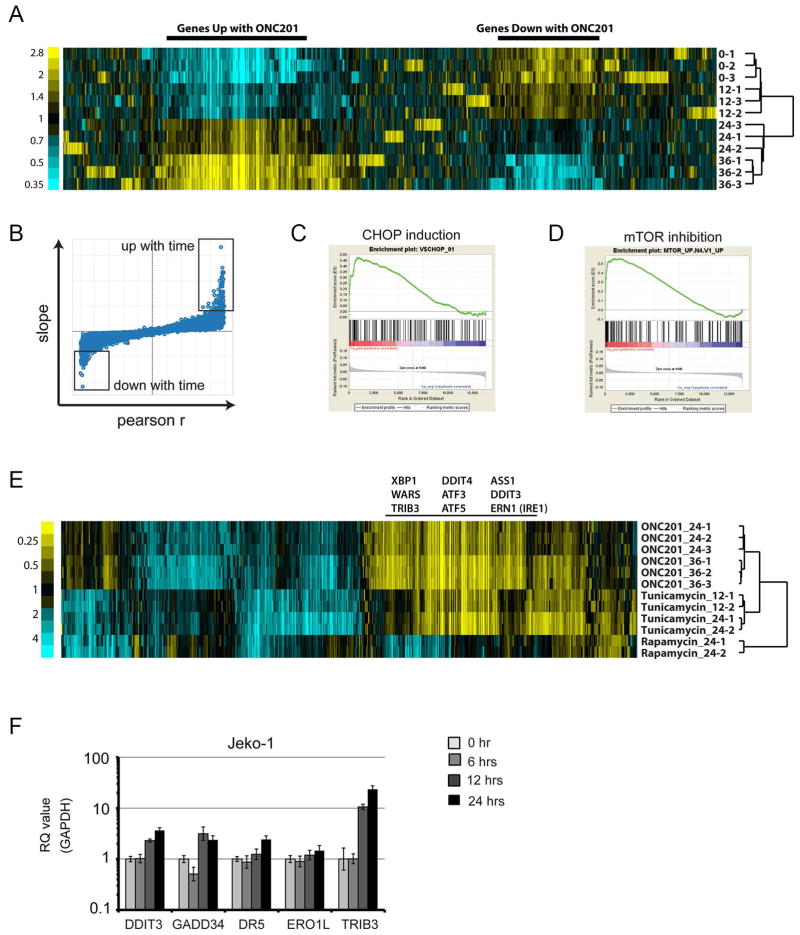
Fig. 4. Gene expression profiling of JeKo-1 cells treated with ONC201.
(A) Mean-centered heat map of variant genes from a time course treatment of JeKo-1 cells with ONC201 (5 μM for 12, 24, and 36 hours) (n = 3 for each time point). (B) Distribution of slope and Pearson’s r values of correlation between gene expression and time. Boxes indicate probes with extreme values of slope and r (data files S1 and S2). (C) Enrichment plot of target genes of CHOP. False discovery rate (FDR) q = 0.016. (D) Enrichment plot of genes that positively correlate with mTOR inhibition. FDR q = 0.000. (E) Subtracted heat map of expression changes (absolute log2 mean-centered value >1 in at least 1 of 12 replicates) in genes of JeKo-1 cells treated with ONC201 (5 μM), rapamycin (10 nM), or tunicamycin (1 μM) for the times indicated (12, 24, or 36 hours) (n ≥ 2 for each condition). (F) Real-time PCR analysis of DDIT3, GADD34, DR5, and ERO1L mRNA expression in JeKo-1 cells during treatment with ONC201 relative to that of GAPDH (n = 3 experiments).

