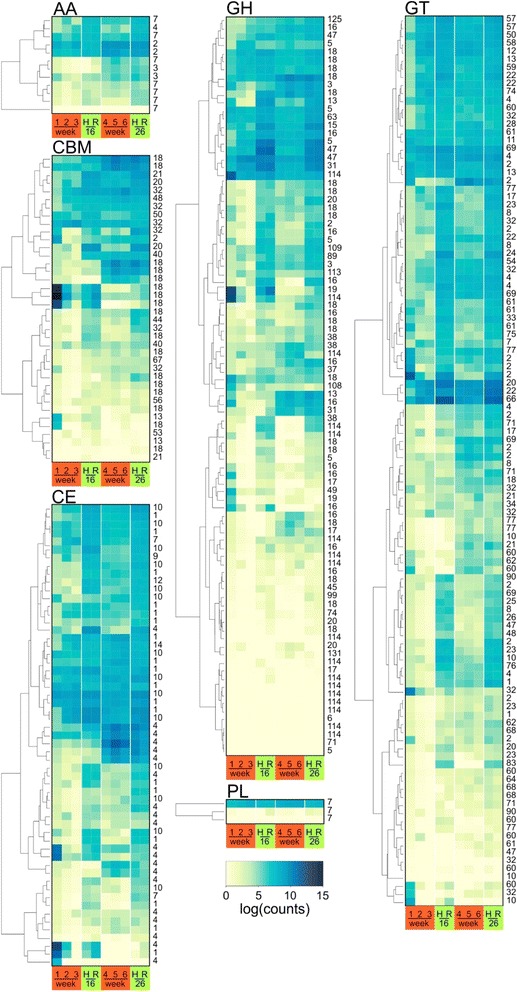
Fig. 2.

A heat map of normalised gene expression (regularised log normal expression output of DESEQ2) of carbohydrate active enzymes in infected B. napus (red boxes: weeks 1–6) and A. thaliana hypocotyl (green boxes) (H) and root (R) tissues at the onset (16 DPI) and late (26 DPI) stages of gall formation. Samples are ordered by similarity but sample similarity dendrograms have been omitted for clarity. AA: Auxillary activities, CBM: Carbohydrate binding modules, CE: Carbohydrate esterases, GH: Glycoside hydrolases, GT, Glycosyl transferases, PL: Pectate lyases. The numbers to the right refer to the class of carbohydrate binding modules as listed in Additional file 10: Table S5
