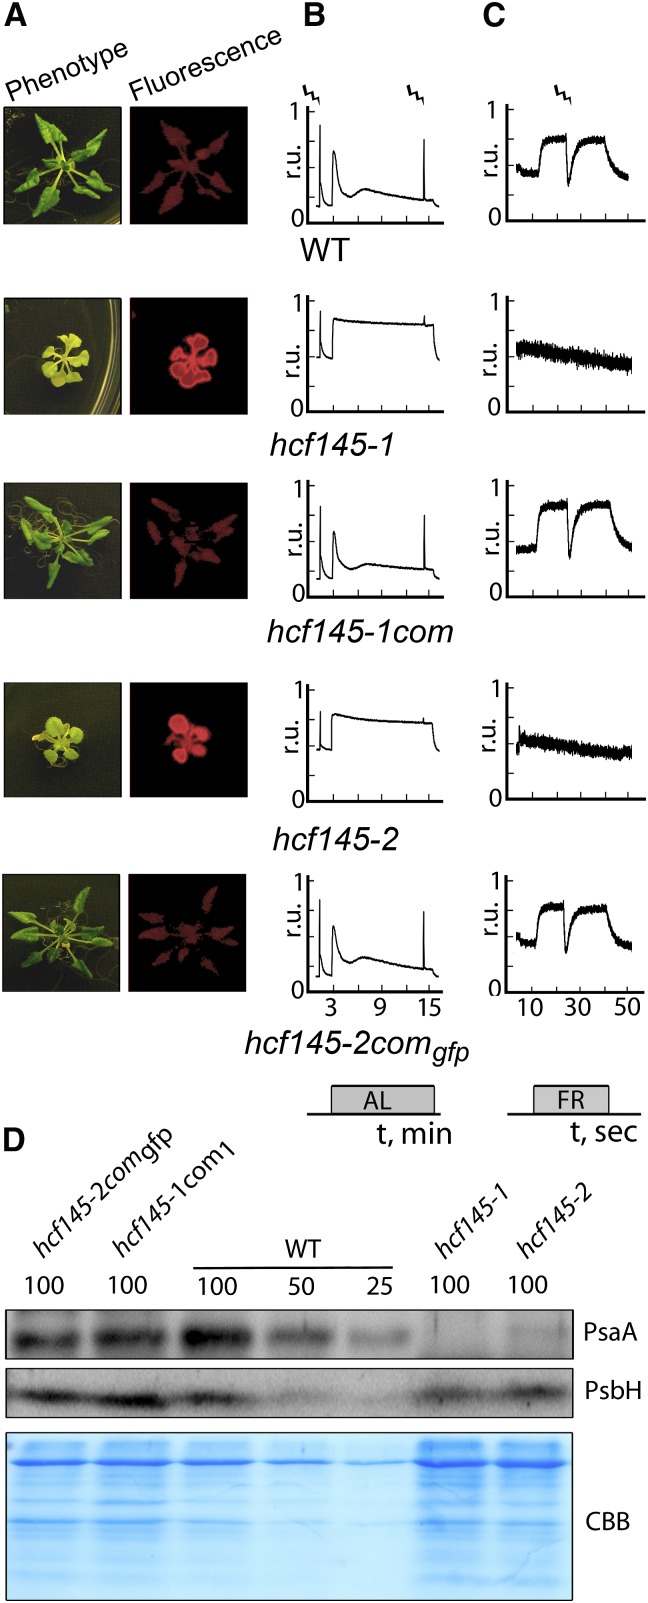
Figure 2.
Spectroscopic and Immunological Analyses of the Arabidopsis hcf145 Mutants.
(A) Photographs and chlorophyll a fluorescence images of 3-week-old plants grown on sucrose-supplemented medium at 10 µmol photons m−2 s−1.
(B) Chlorophyll a fluorescence measurements. Strokes indicate saturating light pulses, and bars indicate the duration of actinic light (AL) application. r.u., relative units.
(C) P700 redox kinetics. Strokes indicate saturating light pulses, and bars indicate the duration of far-red light (FR) application. r.u., relative units.
(D) Immunoblot analyses using specific antisera for the large PSI core subunit PsaA and the PSII subunit PsbH. Protein loading corresponds to 4, 2, and 1 µg chlorophyll (100, 50, and 25, respectively). CBB, Coomassie blue.

