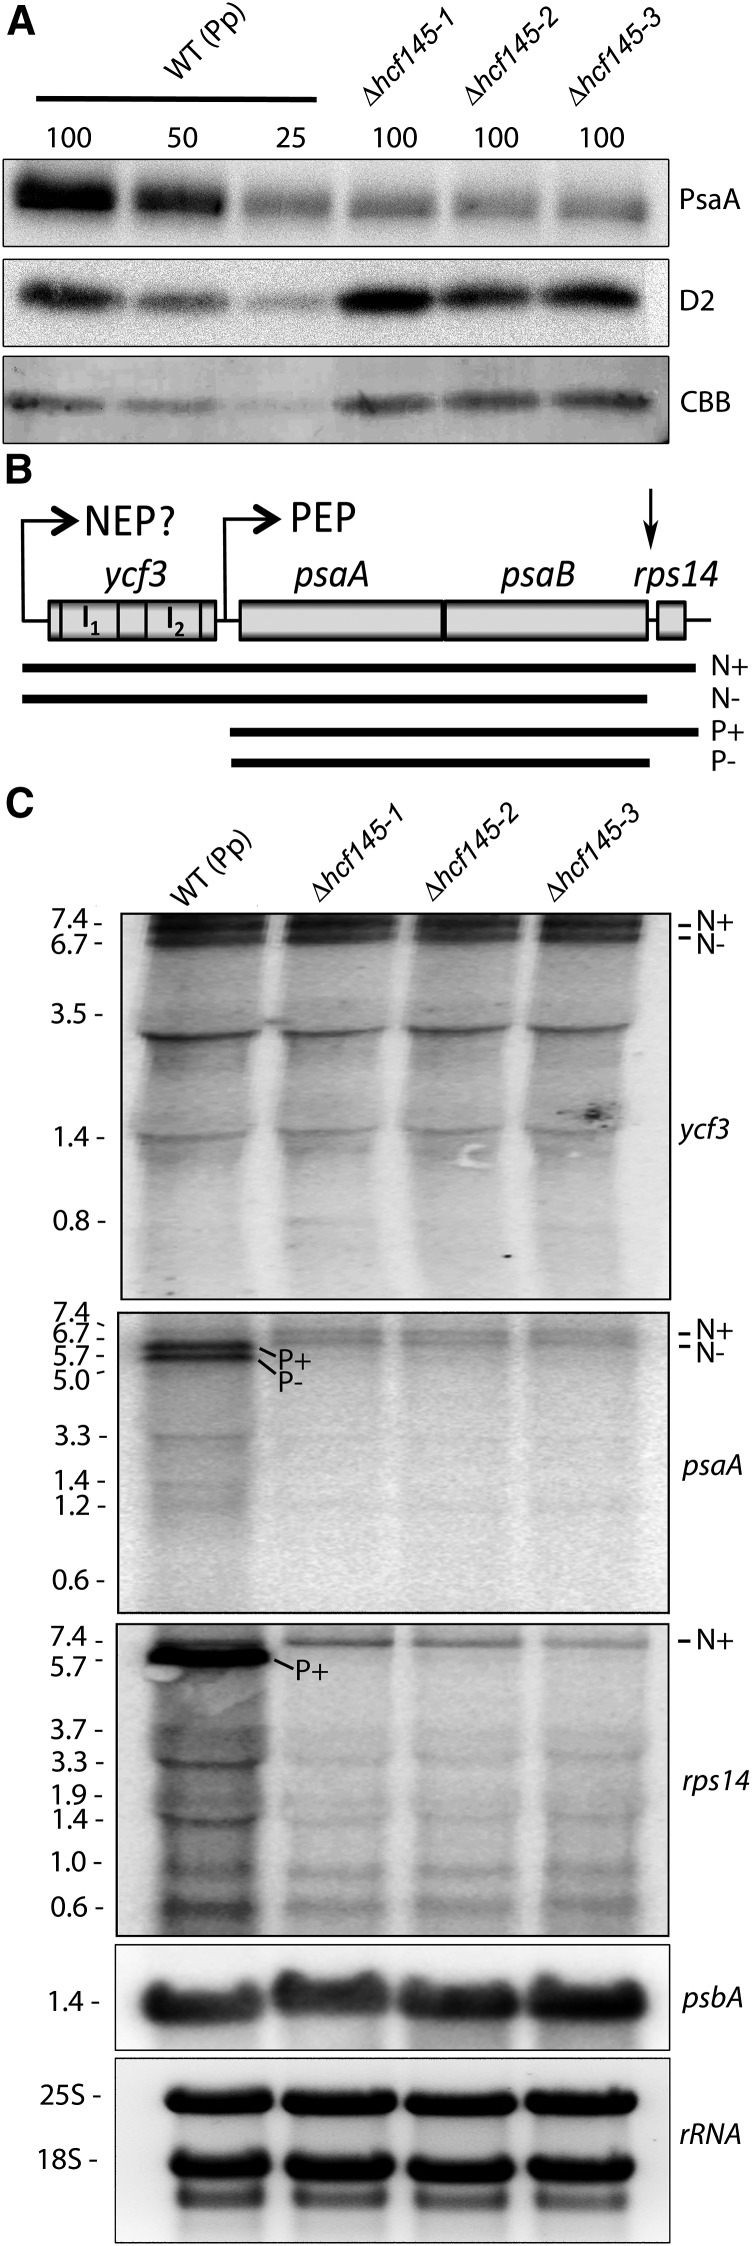
Figure 5.
Immunological and RNA Gel Blot Analysis of Δhcf145 Mutants.
(A) Immunoblot analysis with PsaA- and D2-specific antibodies. Protein loading corresponds to 4, 2, and 1 µg chlorophyll (100, 50, and 25, respectively). CBB, Coomassie blue.
(B) Organization of the ycf3-psaA-psaB-rps14 gene cluster in P. patens. I1 and I2, intron 1 and intron 2, respectively. Primary transcripts generated by the NEP and the PEP and proposed processing products are shown below. N+ and N-, proposed NEP transcripts with and without rps14, respectively; P+ and P-, PEP transcripts with and without rps14, respectively. The ycf3, psaA, psbA, and rps14 probes were generated by PCR using primer pairs ppYcf3_f and -r, ppPsaA_f and -r, ppPsba_f and -r, and ppRps14_f and -r. For the amplification of an intron-less ycf3 probe, we used a cDNA as template.
(C) RNA gel blot analysis using 10 µg total RNA from the wild-type and Δhcf145 lines and hybridization probes specific for ycf3, psaA, rps14, and psbB. The band sizes are given in kilobases on the left.

