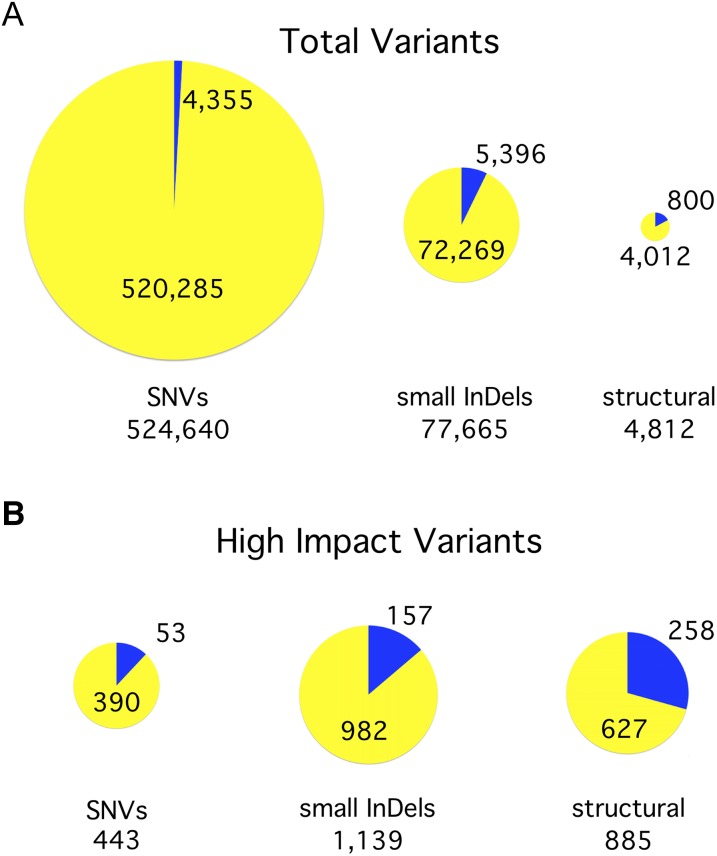
Figure 2.
Summary of Variants by Type.
(A) Identification of variants. We identified 607,117 variants in total, including SNVs, InDels of 40 bp or less (small InDels), and structural variants (insertions, deletions, and inversions >40 bp). The size of each pie chart is proportional to the number of variants in the indicated class. The yellow portion of each pie indicates the percentage of variants in that class that are attributable to a second haplotype inherited from a divergent ancestral parent, referred to in this work as haplotype 2. The blue portion indicates those variants that arose in the laboratory since the original cross.
(B) Effect of variants on gene models. Each variant was graded based on what effect it was predicted to have on nearby gene models. Those variants that were rated to have a high impact on at least one gene are included here in proportionately sized pie charts.

