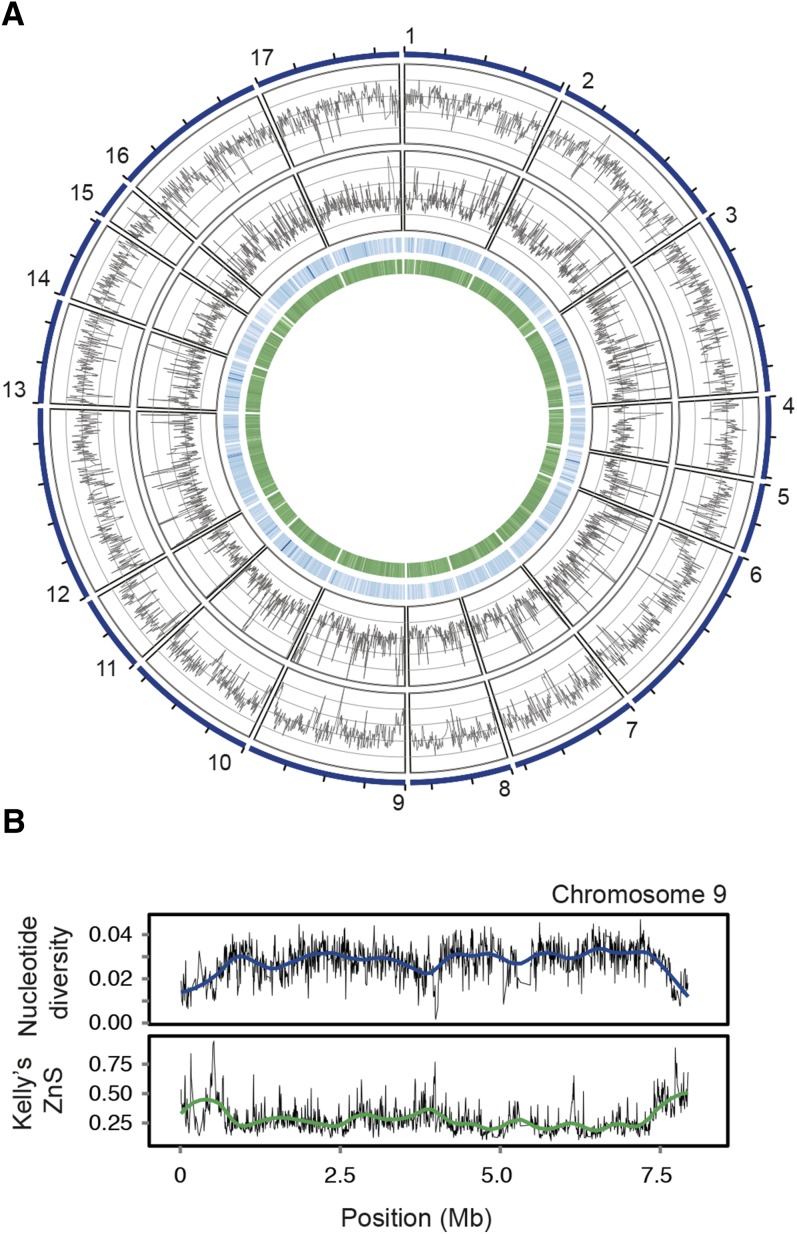
Figure 1.
Genome-Wide Pattern of Polymorphism in Field Isolates of Chlamydomonas.
(A) Genome-wide pattern of polymorphism in field isolates. Circos diagram illustrating (from outermost track to innermost track) nucleotide diversity (π; Nei, 1987), Kelly’s ZnS (i.e., mean linkage disequilibrium; Kelly, 1997), gene density, and GC content on the 17 chromosomes.
(B) Pattern of polymorphism on chromosome 9. Nucleotide diversity (upper panel) and Kelly’s ZnS (lower panel) on chromosome 9 estimated in nonoverlapping windows of 5 kb. Trend lines were fit to the raw data using Loess regression.

