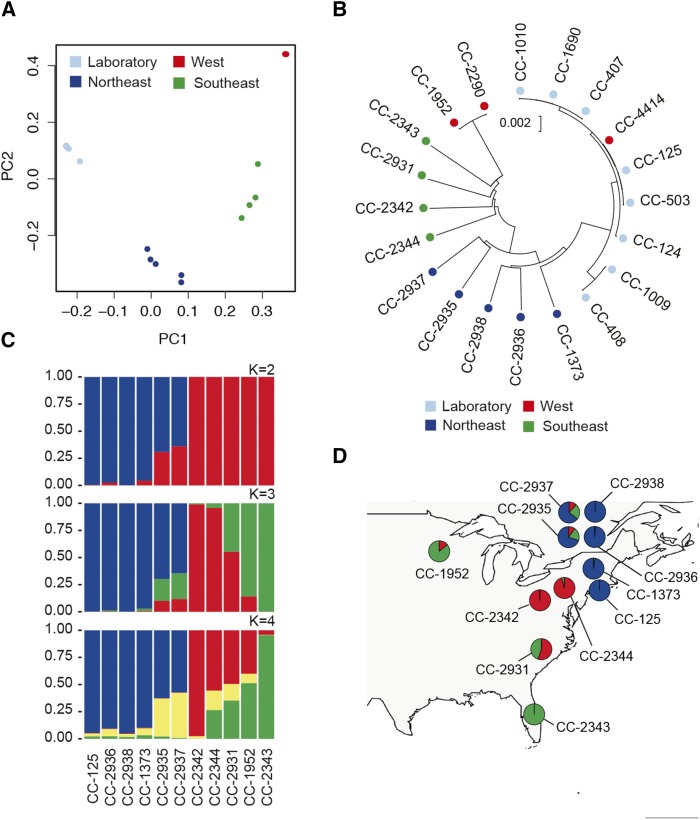
Figure 2.
Population Structure in Chlamydomonas.
(A) PCA of genotypes shows geographic clustering of strains. Sample CC-4414 (red) is hidden behind the cluster of laboratory strains (light blue).
(B) Neighbor-joining tree based on Jukes-Cantor corrected distances (Jukes and Cantor, 1969) for 20 strains. Samples are color-coded based on geographic groupings in (A).
(C) STRUCTURE (Pritchard et al., 2000) analysis based on 10 field isolates and a representative laboratory strain (CC-125). Results show admixture between three (K = 3) ancestral populations.
(D) Admixture proportions in each strain by sampling location. Admixture proportions from STRUCTURE (K = 3) in (C) suggest Chlamydomonas populations are subdivided geographically. Pie charts are placed at the approximate locations where the strains were isolated (Table 1).

