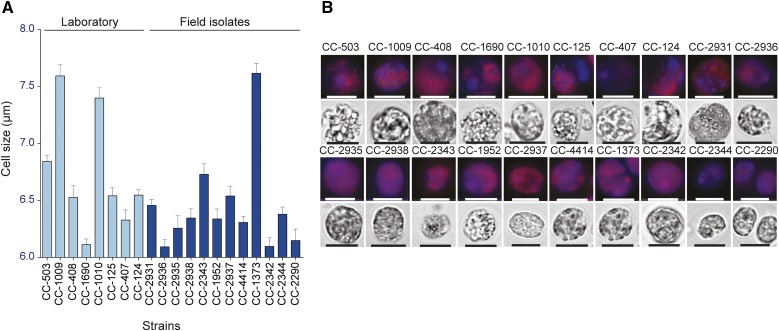
Figure 7.
Phenotypic Variation in Cell Size in Chlamydomonas.
(A) Cell sizes of strains. Values represent means (+se) based on at least 500 cells per strain.
(B) Fluorescent and bright-field micrographs of each strain. DAPI fluorescence (blue) and chlorophyll fluorescence (red) are shown in the upper panels for each strain, created by overlay of the 655- and 448-nm filtered images. Bright-field images are shown in the lower panel for each strain. Bars = 7.5 μm.

