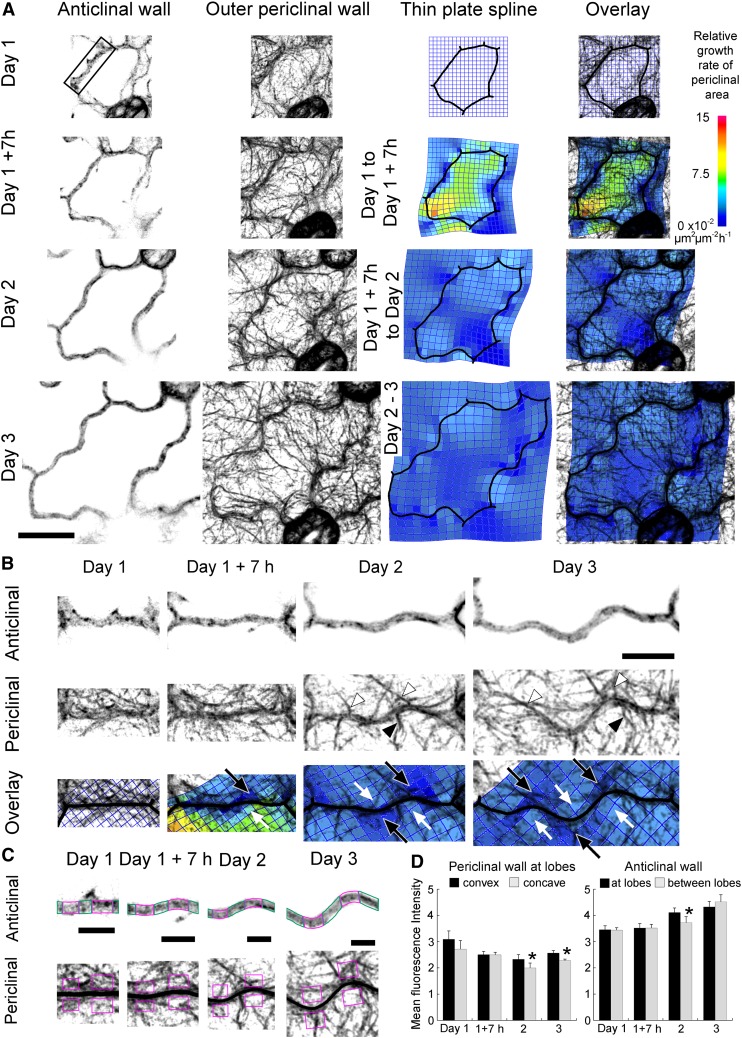
Figure 6.
Actin Filaments Do Not Strongly Associate with Either Side of Lobes during Development of Pavement Cells.
The arrangement of actin filaments and cell wall growth in pavement cells of GFP-fABD2 seedlings from 1 to 3 d after germination. Fluorescence images are optical sections of the anticlinal wall at the middle of the cell and projections of serial sections of the cortical cytoplasm next to the outer periclinal wall. Thin-plate spline analysis predicts relative growth rates of the outer periclinal wall between consecutive time periods.
(A) Filamentous actin in a representative pavement cell from 1 to 3 d after germination. On all days, actin filaments were distributed throughout the cortical cytoplasm. Bar = 20 μm.
(B) Development of three lobes from a relatively straight wall (the boxed region in [A] at higher zoom). Relative growth rates in the outer periclinal wall were promoted on the concave side of forming lobes (white arrows) and were restricted on the convex side of lobes (black arrows). Bundles of actin filaments were at both the concave (black arrowheads) and convex (white arrowheads) side of lobes. Bar = 10 µm.
(C) Fluorescence intensity of actin filaments at the anticlinal wall was measured at lobe tips (areas at lobes outlined in magenta) and other regions of the wall (areas between lobes outlined in green). Fluorescence intensity of the filaments was measured in the cortical cytoplasm adjacent to the periclinal wall (areas within the magenta boxes) on the concave and convex sides of lobes. Bar = 5 µm.
(D) Average actin filament fluorescence intensities at lobes within cells, including the cell in (A), measured as in (C), are represented for each time point with standard errors. Statistically significant differences within a time point are denoted by an asterisk (P < 0.05, two-sample t test). Seven lobes were chosen per cell and one cell per plant. n = 5 plants at each time period.

