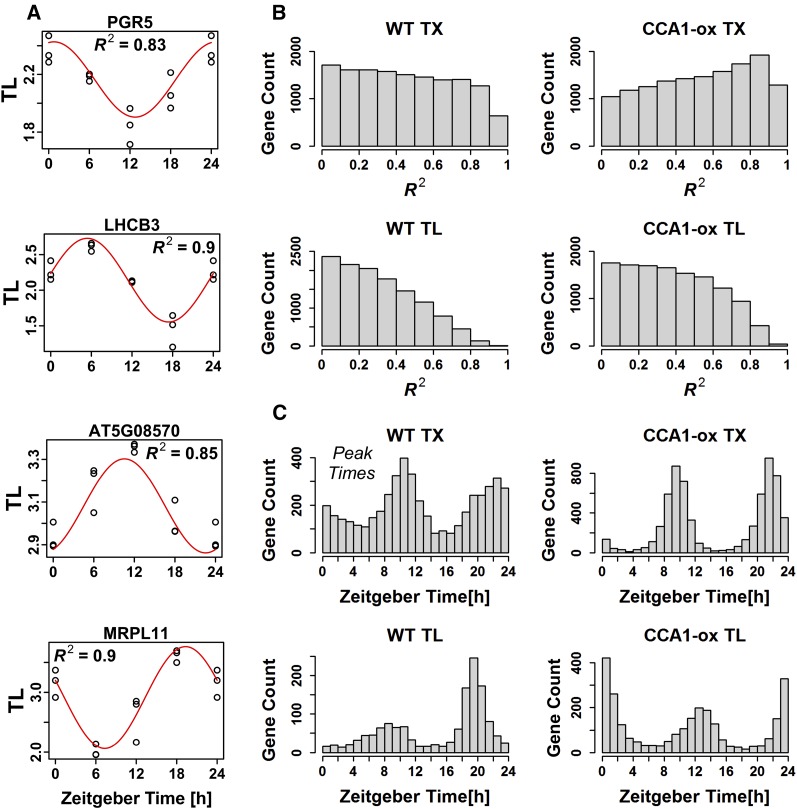
Figure 3.
Diel Cycles of Transcript Levels and Translation States Were Modeled as Sine Waves.
(A) Examples of the fit of representative translation state data to sine waves. The R2 indicates the fraction of the variation in TL that is explained by the sine model.
(B) Distributions of R2 values for TX and TL in the wild type and CCA1-ox. Genes in CCA1-ox have a greater tendency to behave like sine waves in terms of their TX and TL.
(C) Genes with an R2 >0.6 were selected and were binned according to their estimated peak TX and peak TL under the assumption of a sine model. For wild-type TL, the median confidence interval for peak TL was estimated by bootstrapping to be ±1.8 h (5th to 95th percentile range 1.0 to 2.6 h). In (A), PGR5 is photosystem I protein PROTON GRADIENT REGULATION5. LHCB3 is light-harvesting chlorophyll a/b binding protein 3 of photosystem II. At5g08570 is annotated as a pyruvate kinase family protein. MRPL11 is protein 11 of the mitochondrial ribosomal large subunit.

