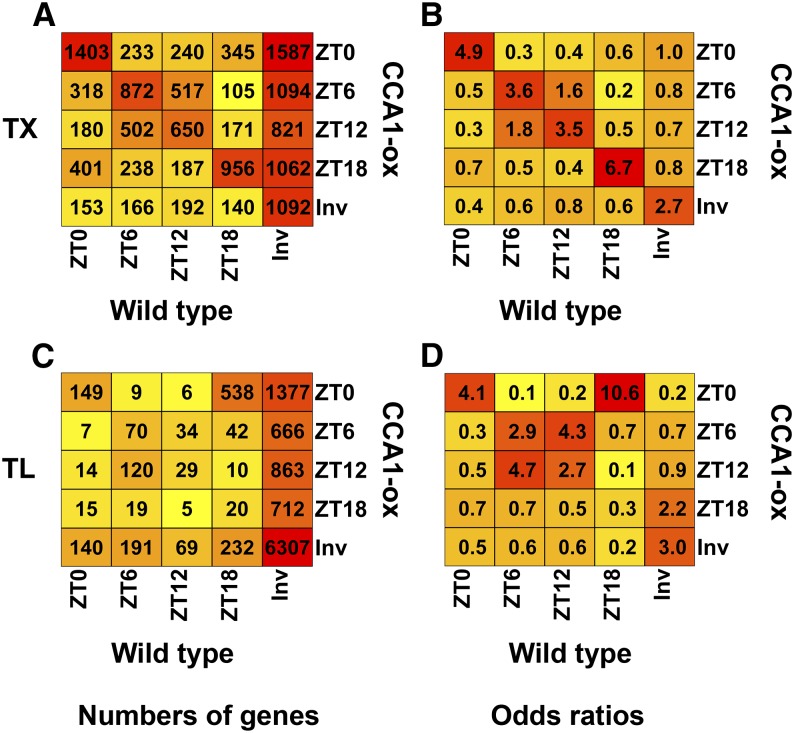
Figure 7.
Phase Diagram Comparing the Expression Cycles between the Wild Type and CCA1-ox.
Genes with significant TX cycles ([A] and [B]) or translation cycles ([C] and [D]) were identified using SAM with the 10% FDR cutoff. All other genes were called invariant (Inv). The genes were binned according to the peak in the wild type and the peak in CCA1-ox.
(A) and (C) Numbers of genes with a given phase relationship are indicated as a heat map.
(B) and (D) Odds ratios for the data shown on the left. For details, see legend to Figure 4.

