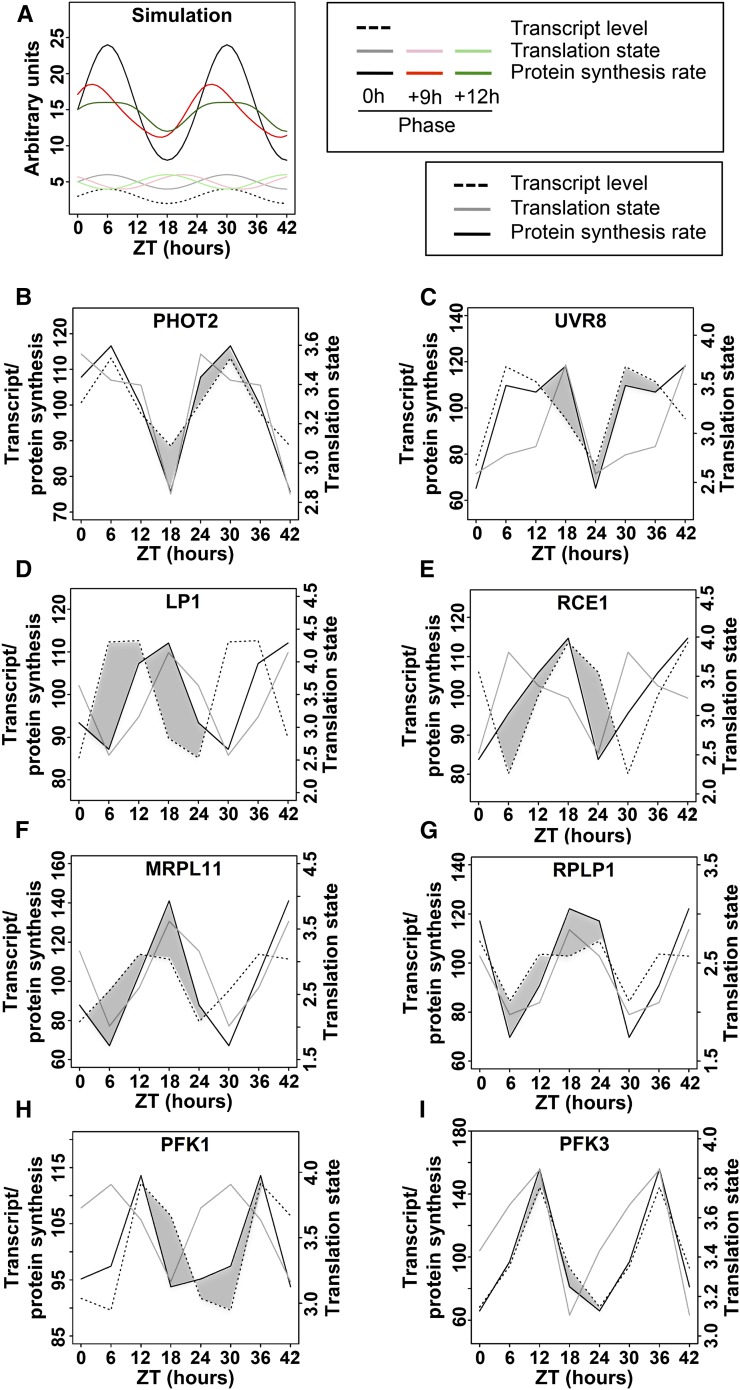
Figure 9.
Simulation of Protein Synthesis Rates from mRNA Transcript Level Data and TL Data.
mRNA levels were multiplied with the corresponding translation states in order to simulate the protein synthesis rate from the given mRNA. The results were extrapolated to 42 h to better visualize the cycling behavior. The mRNA levels and simulated protein synthesis rates are mean-centered (mean = 100) and are displayed on the left y axis, while the TL is displayed as is on the right y axis.
(A) A mathematical simulation of TX level (stippled trace), TL in three possible phases (pale traces), and the three calculated protein synthesis rates (dark traces).
(B) to (H) Actual TX and TL data and the protein synthesis rates calculated from them. The difference in the shape of the transcript level trace and the protein synthesis trace is accentuated with dark shading. ZT, zeitgeber time.

