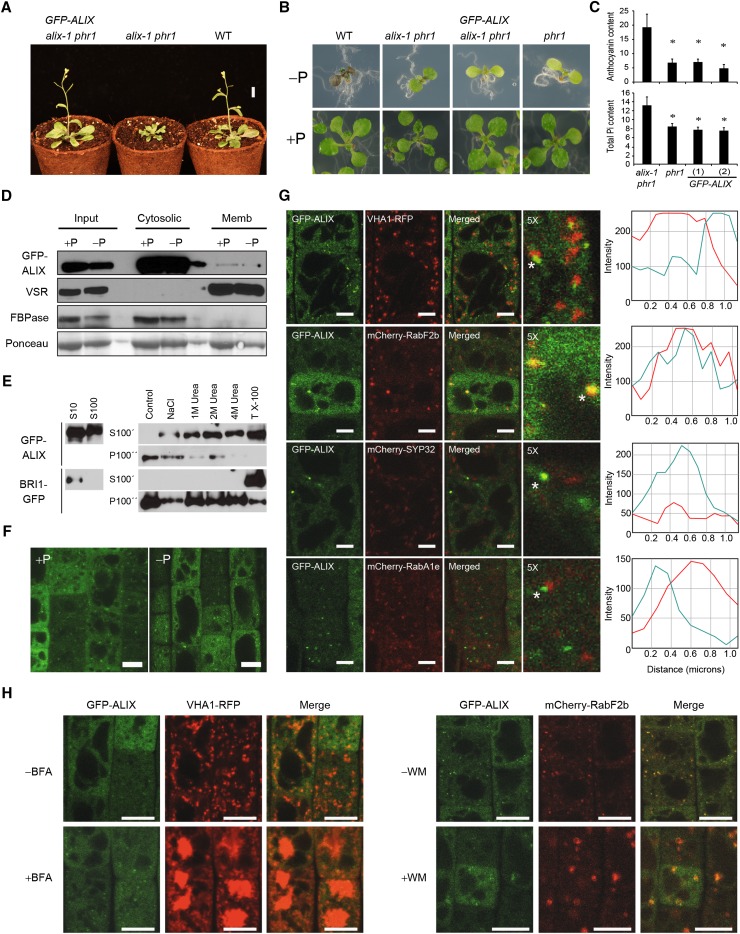
Figure 4.
Functional GFP-ALIX Fusion Protein Localizes in Both Cytosolic and Microsomal Fractions.
(A) Plants corresponding to the wild type (WT), alix-1 phr1, and alix-1 phr1 transformed with a construct containing the ALIX genomic region fused to GFP driven by the ALIX promoter (GFP-ALIX) were grown in soil for 3 weeks before photographs were taken. Bar = 1 cm.
(B) Plants as in (A) together with phr1 were grown in Pi-deficient and Pi-rich media for 12 d before photographs were taken.
(C) Histograms showing anthocyanin and Pi content in phr1, alix-1 phr1, and GFP-ALIX (two independent transgenic lines) plants. Error bars indicate standard deviations. *P < 0.05 (Student’s t test) with respect to the phr1 mutant in the same experimental conditions.
(D) Isolation of microsomes from postnuclear fractions (Input) of 10-d-old GFP-ALIX seedlings grown under Pi-rich (+P) and -deficient (−P) conditions. GFP-ALIX was found in the soluble fraction (Cytosolic), which corresponds to cytosol, as well as associated to microsomes (Memb).
(E) Membrane association of GFP-ALIX can be disrupted with chaotropic agents and detergents. Supernatant (S10) samples were ultracentrifuged to give soluble fractions (S100) and pellets. Pellets were resuspended in homogenization buffer without additives (control); with 1 M NaCl (NaCl); with 1, 2, or 4 M urea; or with 1% Triton X-100 (TX-100) and ultracentrifuged again, giving wash fractions (S100’) and pellets. This procedure was repeated to give washed pellets (P100’’). Same procedures were followed with BRI1-GFP as a detergent-solubilized control.
(F) Confocal images of root epidermal cells from 5-d-old GFP-ALIX seedlings grown under Pi-deficient (−P) and -rich (+P) conditions. Bars = 10 μm.
(G) Confocal images of root epidermal cells of 5-d-old seedlings expressing GFP-ALIX and different cell compartment markers; VHA1-RFP (early endosome), mCherry-RabF2b (MVB), mCherry-SYP32 (Golgi), mCherry-RabA1e (recycling endosome). The 5× enlarged images of merged color channels are shown. ImageJ quantification of green (turquoise lines) and red (red lines) signal intensities for spots indicated by asterisks. Bars = 5 μm.
(H) BFA (left panels) and WM (right panels) treatments of 5-d-old GFP-ALIX seedlings expressing VHA1-RFP (for BFA) or mCherry-Rabf2b (for WM). Bars = 10 μm.

