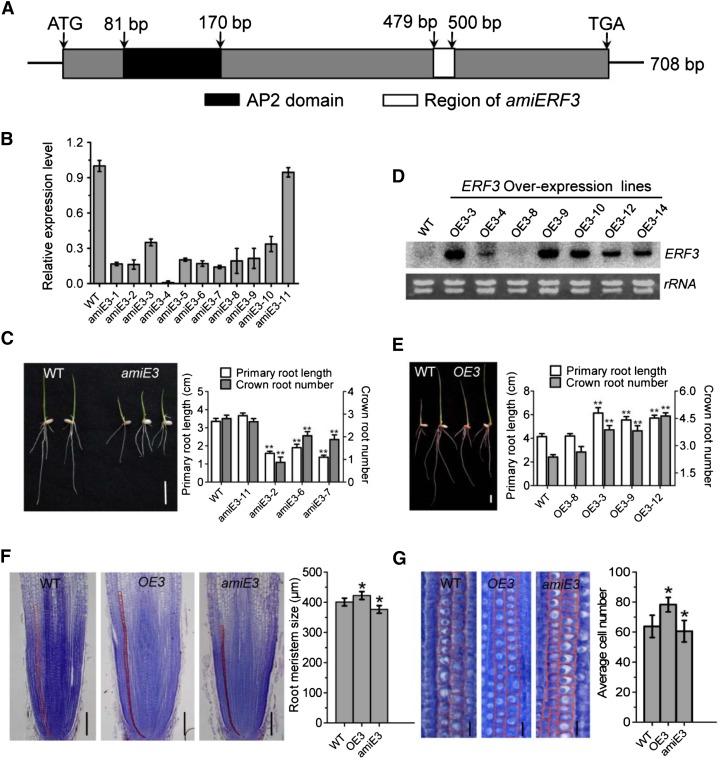
Figure 3.
Analysis of ERF3 amiRNAs and Overexpression Transgenic Plants.
(A) Schematic representation of the ERF3 cDNA. The black box corresponds to the conserved domain (AP2 domain). The cDNA region used to construct the artificial microRNAs vector is indicated by the white box.
(B) RT-qPCR analysis of ERF3 transcripts in the wild type and 11 amiRNA (amiE3) transgenic lines. The PCR signals were normalized with ACTIN1 transcripts. Transcript level from the wild type was set at 1. Bars are means ± sd from three technical replicates.
(C) Comparison of primary root length and crown root number of 1-week-old seedlings between the wild type (WT; left) and the amiRNA line (amiE3; right). Picture and statistical data were taken from lines amiE3-2, amiE3-6, and amiE3-7, which showed similar phenotypes. amiE3-11 was used as a negative control. Bar = 1 cm.
(D) RNA gel blot analysis of ERF3 overexpression plants (OE3) in different transgenic lines compared with the wild type. The rRNA levels were revealed as controls. Statistical analyses of the data in (C) and (D) are presented in Table 1.
(E) Comparison of primary root length and crown root number of 1-week-old seedlings between wild-type (left) and overexpression plants (OE3; right). Picture and statistical data were taken from lines OE3-3, OE3-9, and OE3-12, which showed similar phenotypes. OE3-8 was used as a negative control. Bar = 1 cm.
(F) and (G) Histological analysis of crown root tip in the wild type, ERF3 amiRNAs (amiE3), and overexpression plants (OE3). Red lines delimit the meristem size (i.e., the distance between the quiescent center and the transition zone) (G). Cell number in meristem zone of wild-type, ERF3 overexpression (OE3), and amiRNA (amiE3) roots. Statistical analyses (t test) of data in (F) and (G) were performed with the wild type (n = 16), ERF3 overexpression (OE3; n = 20), and amiRNAs (amiE3; n = 17). Error bars in (F) and (G) represent sd. *P < 0.05.

