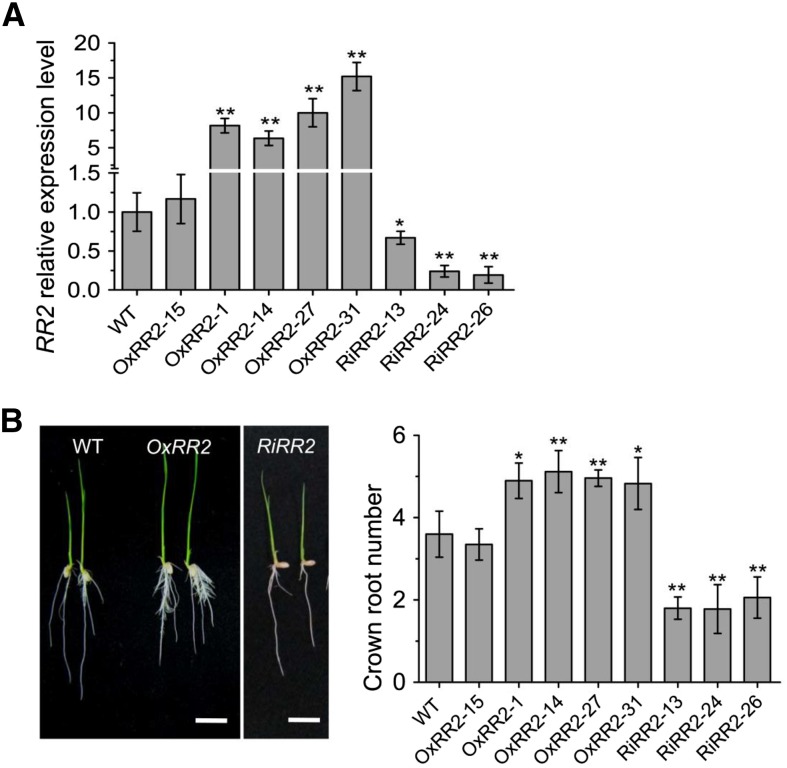
Figure 8.
Root Phenotypes of RR2 Overexpression and RNAi Transgenic Plants.
(A) Relative RR2 transcript levels in the wild type (set as 1), five RR2 overexpression (OxRR2), and three RR2 RNAi lines (RiRR2). The PCR signals were normalized with ACTIN1 transcripts. Transcript level from the wild type was set at 1. Error bars represent sd. *P < 0.05 and **P < 0.01.
(B) Root phenotype of RR2 overexpression (OxRR2), three RNAi (RiRR2) transgenic plants, and the wild type (WT). Statistical analyses of the data are presented in Table 3. Bars = 1 cm.

