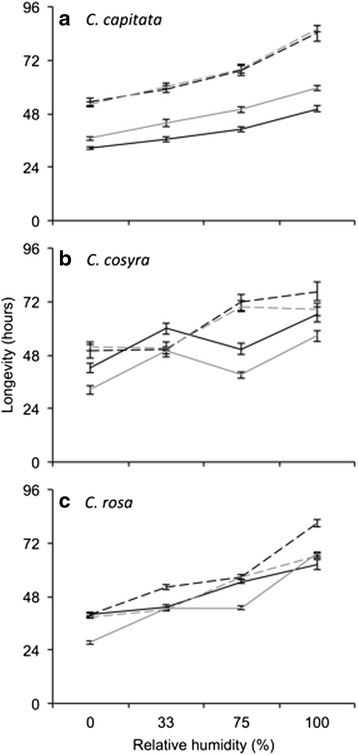
Fig. 2.

Longevity of Ceratitis capitata (a), C. cosyra (b) and C. rosa (c) during an assay where individual females and males were starved at different temperatures and levels of relative humidity. Longevity was predicted from a parametric survival regression that included initial body mass as a covariate. Line colour represents the sexes: black = female, grey = male. Line style represents temperature: dashed = 25 °C, solid = 30 °C
