Fig. 5.

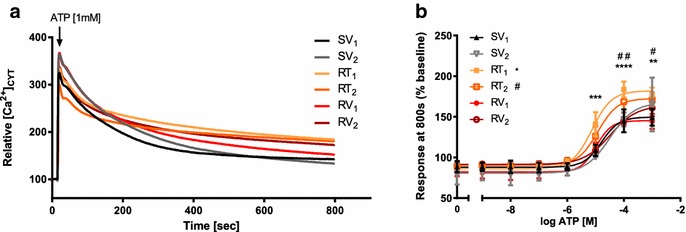
Intracellular calcium measurements with ATP stimulation in trastuzumab-sensitive and resistant cell lines. a Example of relative cytosolic calcium [Ca2+]CYT responses after ATP [1 mM] stimulation in trastuzumab-sensitive age-matched controls (SV1, SV2), acquired resistant cell lines (RT1, RT2) and intrinsic resistant cell lines (RV1, RV2). b Relative calcium [Ca2+]CYT responses at 800 s with ATP stimulation [1 nM to 1 mM] in aged-matched control and resistant cell lines (n = 3 ± SD). Acquired resistant cell lines (RT1, RT2) showed a slower recovery after ATP stimulation with a significant higher relative calcium [Ca2+]CYT level at 800 s while intrinsic resistant cell lines (RV1, RV2,) showed similar recovery rate and similar relative calcium [Ca2+]CYT levels compared to aged matched control SV1. Statistical analysis was performed using two-way ANOVA with Bonferroni post-tests, compared to SV1 (*p ≤ 0.05, **p ≤ 0.01, ***p ≤ 0.001, ****p ≤ 0.0001)
