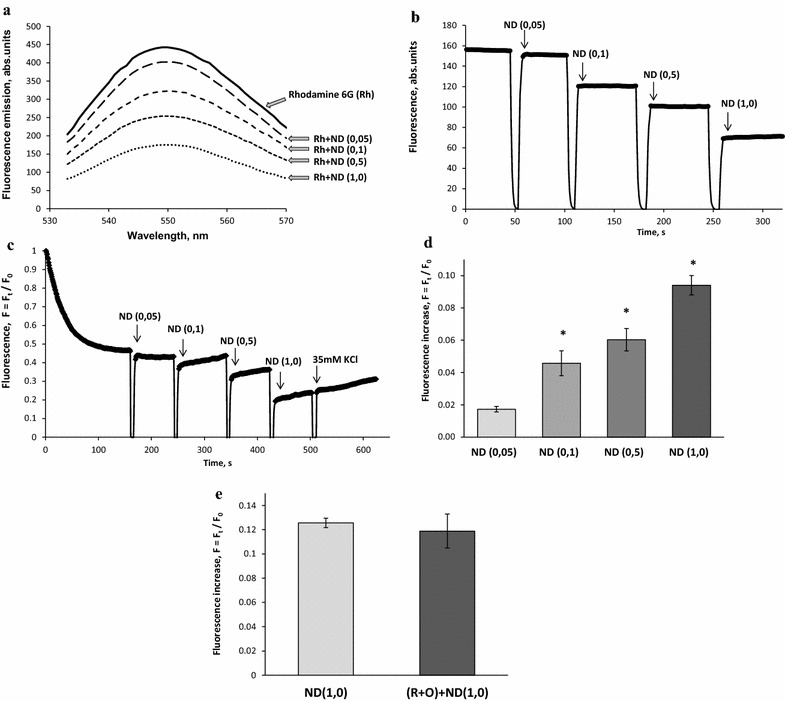
Fig. 5.

a Fluorescence emission spectra of rhodamine 6G (0.5 μM) in the standard salt solution before and after application of NDs (0.05–1.0 mg/ml). b Quenching of fluorescence signal of rhodamine 6G (0.5 μM) in the presence of NDs (0.05–1.0 mg/ml) without synaptosomes; c Dose-dependent effect of NDs (0.05–1.0 mg/ml) on the membrane potential of synaptosomes; d an increase in the fluorescence signal of rhodamine 6G in response to application of NDs (0.05–1.0 mg/ml); e an increase in the fluorescence signal of rhodamine 6G in response to application of NDs (1.0 mg/ml) without (the first column) and in the presence of 5 µM rotenone and 5 µg/ml oligomycin (R + O) (the second column). The suspension of synaptosomes was equilibrated with potential-sensitive dye rhodamine 6G (0.5 µM); when the steady level of the dye fluorescence had been reached, NDs at concentrations 0.05–1.0 mg/ml were added (marked by arrows) to synaptosomes. Trace represents four experiments performed with different preparations. Data is mean ± SEM. *p < 0.05 as compared to the steady level of the dye fluorescence
