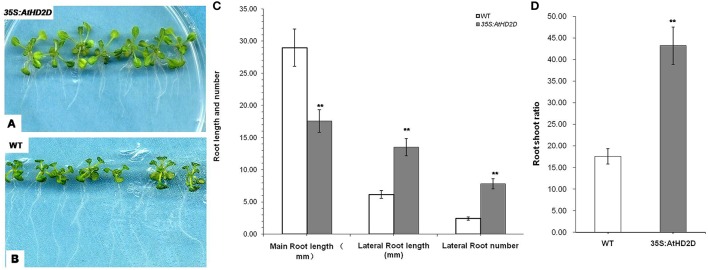
Figure 5.
Root development of wild-type and 35S:AtHD2D transgenic plants. The error bars represent the SD. The data are presented as the mean ± standard deviation of the mean (SD) and were tested for significant difference using Student's t-test (**p < 0.01). (A,C) Roots of wild-type (WT) 10 days after germination. (B,D) Phenotype of roots and leaves of 35S:AtHD2D of transgenic seedlings 10 days after germination. (E) Root and shoot ratio of WT and 35S:AtHD2D transgenic plants 10 days after germination on MS medium. (F) Root length and root number of WT and 35S:AtHD2D transgenic plants.

