
Fig. 2.
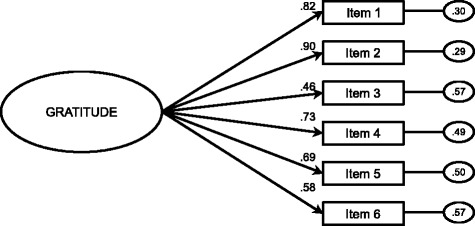
Confirmatory factor analysis GQ-6 in the adult sample. Note* The oval represents the unique factor and the rectangles represent the six different items. The residual variances are shown in the small circles on the right
Official websites use .gov
A
.gov website belongs to an official
government organization in the United States.
Secure .gov websites use HTTPS
A lock (
) or https:// means you've safely
connected to the .gov website. Share sensitive
information only on official, secure websites.
Confirmatory factor analysis GQ-6 in the adult sample. Note* The oval represents the unique factor and the rectangles represent the six different items. The residual variances are shown in the small circles on the right