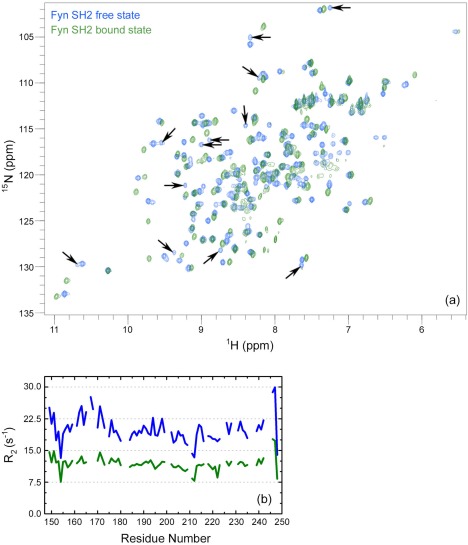
Figure 7.

NMR studies of human Fyn SH2 domain (a) Overlay of the 800 MHz 1H‐15N HSQC spectra of Fyn SH2 in its free form (blue; dimeric state) and in complex with the specific‐pY peptide (green; monomeric state). The arrows indicate the doubling and/or additional peaks attributed to the dimeric state. (b) The Fyn SH2 transverse relaxation rates in function of the residue number for both states, maintaining the same coloring coding as in (a).
