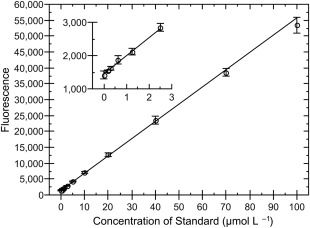
Figure 2.

Sensitivity of fluorescamine assay. Several concentrations of unacetylated lysine (ac‐K‐NH2) in reaction buffer were treated in the same manner as reactions. Error bars represent the standard deviation of triplicate measurements. Line represents a weighted linear fit to the data. r 2 = 0.9998. Inset shows the same data zoomed to only the low concentrations, illustrating the fit to points at both extremes.
