
Figure 2.
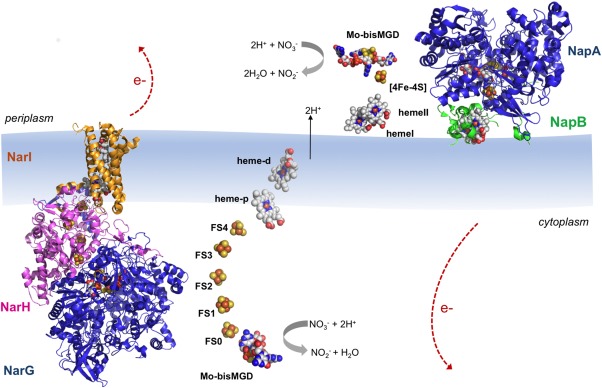
Overall structures of E. coli NarGHI (PDB ID: 1Q16) and C. necator NapAB (PDB ID: 3ML1) according to their localization in the cell. The catalytic subunits NarG and NapA are represented in blue; the NarH is represented in pink; and the heme containing subunits NarI and NapB are represented in orange and green, respectively. The protein cofactors (Mo bis‐MGD, FeS clusters and heme groups) are represented color‐coded. Note that the electron transfer pathway in both enzymes follows cofactor localization: electrons generated at the active site flow through the FeS centers until they reach the heme groups, from where they are dissipated. The five FeS clusters in NarGHI are referred to as FS0–FS4 with increasing distance from the Mo bis‐MGD.