Figure 6.

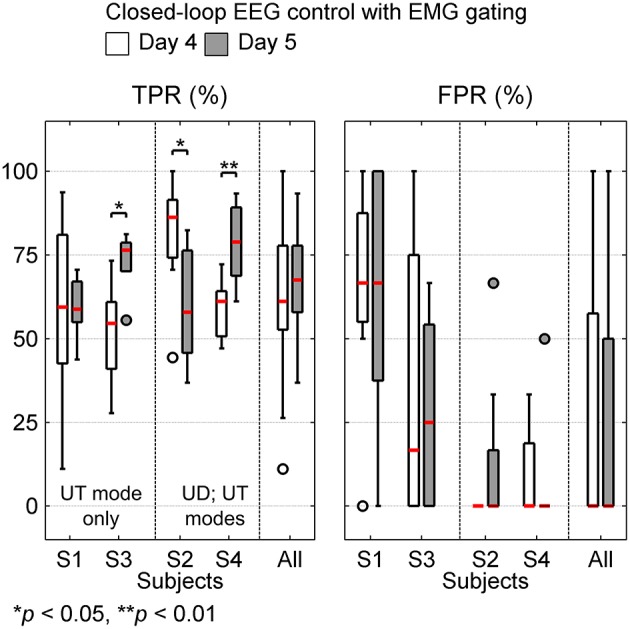
Box plots show true positive rate (TPR) and false positive rate (FPR) for closed-loop BMI performance on days 4 and 5. TPR and FPR were calculated on attempted trials (15–19 trials/block, overall 1063 trials) and catch trials (1–5 trials/block, overall 157 trials), respectively. The median values for BMI performance are shown in red. In each sub-plot, the last column shows the overall BMI performance achieved across all subjects. Subjects S1 and S3 using user-triggered (UT) mode on both days are grouped together. Similarly, S2 and S4 using user-driven (UD) on day 4 and user-triggered (UT) on day 5 are grouped together.
