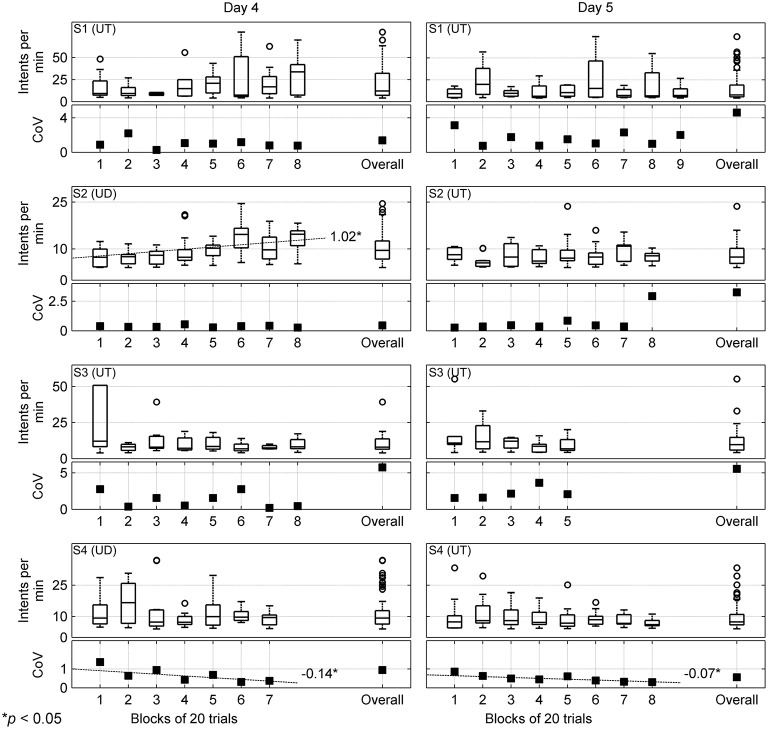
Figure 7.
Number of motor intents detected per min (or Intents per min) and its coefficient of variation (CoV) are computed for each block of 20 trials that tested the closed-loop BMI control and are shown here for days 4 and 5 by the left and right columns, respectively. The subject names and calibration modes are shown in the top left corner for each row. Each row consists of a box plot displaying number of intents per min and a plot showing their CoV for each block. Additionally, within each plot the overall intents per min and CoV that were computed by combining performance of all blocks for that day is shown. Outliers are represented by “°”; however few outliers outside the axes range are not shown. The dotted lines show statistically significant trends in the median values for intents per min and individual values of CoV across all blocks for that day, along with their slopes. UD, user-driven mode; UT, user-triggered mode.

