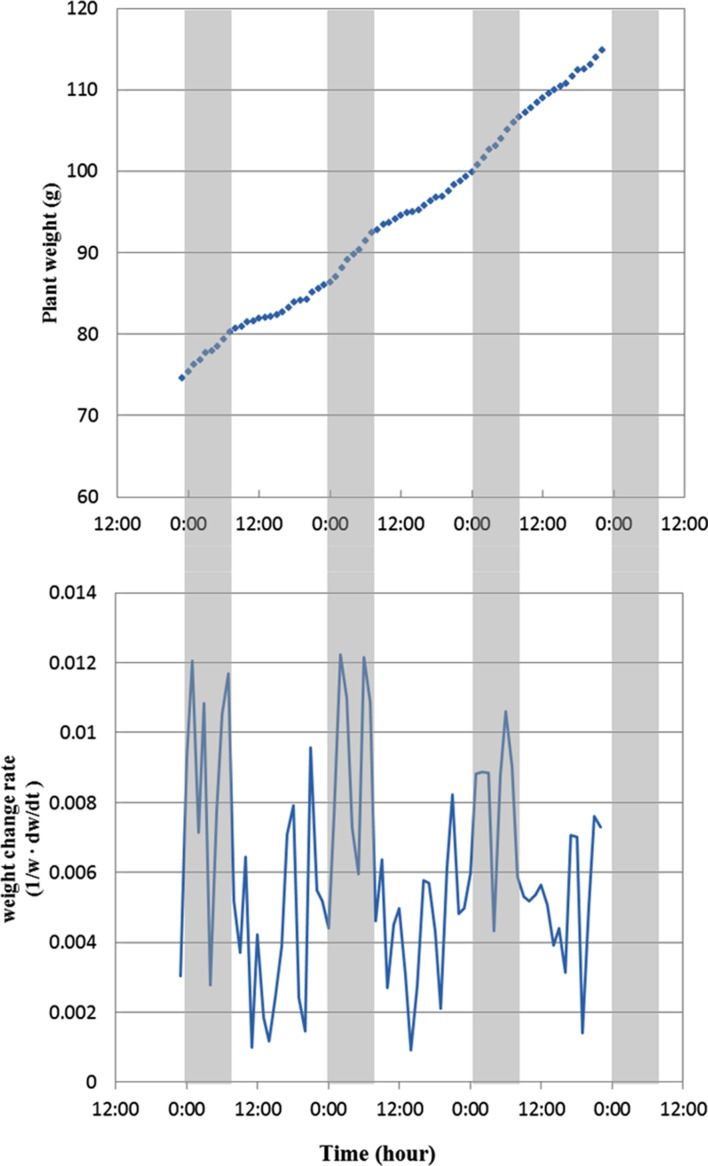
FIGURE 6.
Diurnal change of plant weight (top) and weight change rate (bottom) from day 15 to day 18 of the growing period. The gray area indicates the dark period, and white area is light period. The weight change rates are calculated as the weight difference between previous and current hour over current hour weight.

