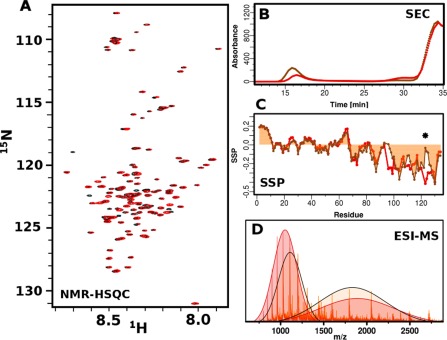
Figure 2.

Biophysical characterization of βS and P123H‐βS mutant. (A) 1H‐15N‐HSQC spectra of βS (red) and P123H‐βS mutant (black) in 10mM MES, pH6, 100mM NaCl. (B) ESI‐MS of βS (red) and P123H‐βS (orange) in 10mM ammonium acetate buffer, pH 6. Extended and compact conformations are indicated by fitting two Gaussians. βS populates 46% compact and 54% extended conformations while P123H‐βS populates 51% compact and 49% extended conformations. (C) Comparison of secondary structure propensities (SSP) of βS (red) and P123H‐βS (orange) in 10mM MES, pH6, 100mM NaCl. Positive values indicate α‐helical secondary structure propensity, while negative values correspond to β‐Sheet or PPII propensity. The star indicates the position of the mutation. (D) Size exclusion profile using the Superose 6 column, which has a separation range of 5000 to 5000000 Da for βS (red) and P123H‐βS (orange) after 5 h of incubation at 37°C with agitation in PBS, pH 7.4. βS and P123H‐βS have similar monomer elution profiles and P123H‐βS generates oligomers that are eluted in the void volume.
