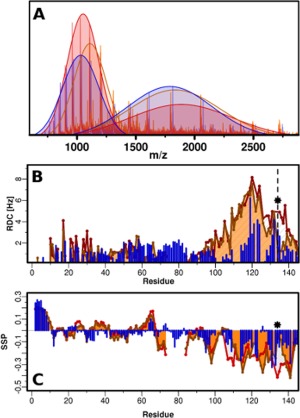
Figure 4.

Three way comparison of αS (blue), βS (red) and P123H‐βS (orange). (A) ESI‐MS in 10mM ammonium acetate buffer, pH 6. Extended and compact conformations are indicated by fitting two Gaussians. αS: compact, 49%, extended 51%; βS: compact 46%, 54%; P123H‐βS: compact, 51%, extended 49% (B) RDC profiles of αS (blue), βS (red) and P123H‐βS (orange) in 10mM MES, pH 6, 100 mM NaCl, 250μM protein, measured in C8E5‐octanol bicelle aligning media. The star and dashed line indicate the position of the mutation. (C) SSP measured in 10mM MES, pH 6, 100 mM NaCl, 350μM proteins for αS (blue), βS (red) and P123H‐βS (orange).
