Figure 5.

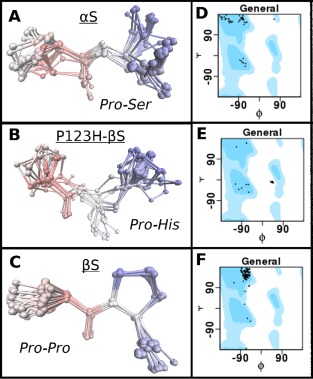
Comparison of possible conformational propensities of C‐terminal motifs of αS (PS), P123H‐βS (PH) and βS (PP) as described by Ramachandran plots. PDB database search was performed using the Psi‐Blast algorithm to obtain fragments which contain motifs PS (αS), PH (P123H‐βS) and PP (βS), but also shared similarity to the C‐terminal sequences. (A‐C) RMSD calculation and structure overlays of the hits were performed for: (A) αS (PS), (B) P123H‐βS (PH) and (C) βS (PP). (D‐E) Phi, Psi population distribution of the different hits for the respective motifs displayed as Ramachandran plots. General shows all of the allowed areas for proteins in blue and dots represent the positions of the Phi, Psi angles for the hits. Position of the Ramachandran plot shows ability of motifs to exist in certain secondary structures. Position of the secondary structures on the Ramachandran plot (Phi, Psi): helix: (−63, −43), beta‐sheet (−135, 135), PPII (−75, 150), L‐alpha helix (57, 47). (D) αS (PS), (E) P123H‐βS (PH) and (F) βS (PP.)
