
Figure 5.
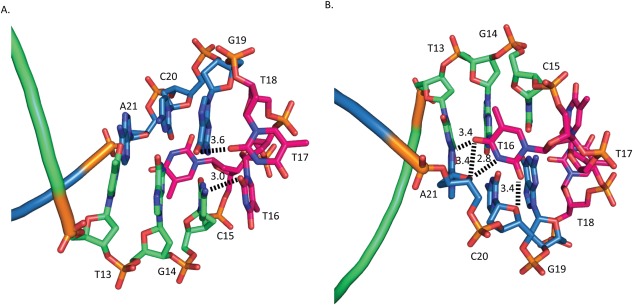
Aptamer hydrogen‐bonding interactions. Template strand is shown in blue, primer strand is shown in green, and hairpin‐loop residues in red. A. View of the aptamer looking towards the RNase H active site with bonding network created by T16, T17, and G19. B. 180° Rotation of A, showing interactions of T16.