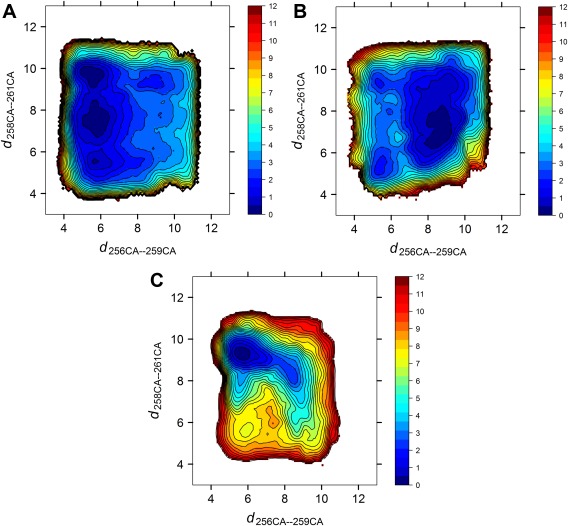
Figure 2.

Free energy landscape of the conformational changes in the truncated linker region. All free energies are in the unit of kcal/mol. (A) Wild‐type Src, the kinase domain is in the inactive conformation. (B) Wild‐type Src, the kinase domain is in the active conformation. (C) The W260A mutant, the kinase domain is in the inactive conformation.
