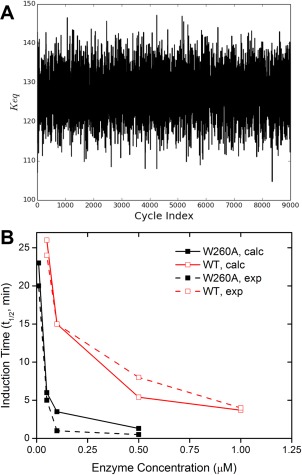
Figure 5.

Outputs from out kinetic model. (A) Time series of K eq (between the inactive and the active species) for the W260A kinase domain from the BMC estimation. (B) The calculated t 1/2 with respect to initial concentration of the kinase. The experimental data extracted from Ref. 25 are also displayed for comparison.
