
Figure 7.
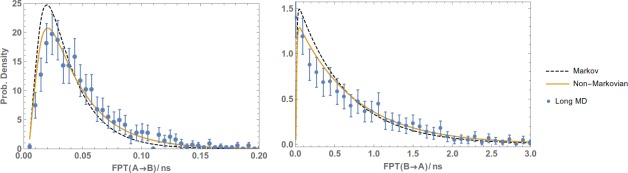
Non‐Markovian estimation of the the FPT distribution of the methane/methane system from WE data. FPTDs of the methane/methane system from A to B (left plot) and from B to A (right) were obtained by post‐analysing a WE simulation using a regular first‐order Markov analysis (Markov) and non‐Markovian analysis (Non‐Markovian). The results are compared with a reference long MD simulation and error bars indicating a 95% confidence interval.