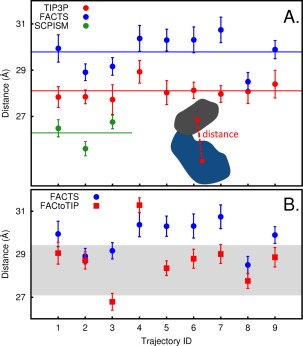
Figure 5.

A: Average distances between the center of mass (COM) corresponding to the N‐lobe (residues 233 to 322) and C‐lobe (residues 323 to 384 and 411 to 504) of Lyn kinase domain calculated from simulations with TIP3P (red filled circles), FACTS (blue filled circles), and SCPISM (green filled circles). The standard deviations from the averages are shown as error bars. The red, blue and green solid lines indicate the mean of the average distances corresponding to TIP3P, FACTS, and SCPISM, respectively. A, inset: A schematic of the Lyn KD to illustrate the COM (red circles) distance (red dashed line) between the N‐lobe (gray) and C‐lobe (blue). B: Average COM distances for FACtoTIP trajectories initiated with coordinates from FACTS trajectories and solvated with TIP3P water molecules (red filled squares). The starting structure of each TIP3P simulation was extracted from a FACTS simulation of the same Trajectory ID. The COM distances from these FACTS trajectories are shown for comparison (blue filled circles). The standard deviations from the averages are shown as error bars. The shaded region displays the range of the lobe‐lobe distance calculated from the original set of trajectories with TIP3P.
