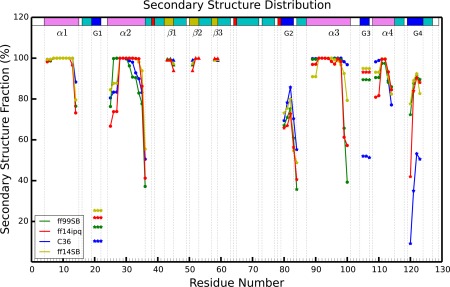
Figure 3.

Comparison of secondary structure elements during each of four different force field simulations. Residue numbers are on the x‐axis and percentage of simulation time spent in a particular type of secondary structure is on the y‐axis. Each simulation is represented by a different color and each type of secondary structure is shown by a different geometric figure (α, β, and G are alpha helix, beta sheet, 310 helix, respectively).
