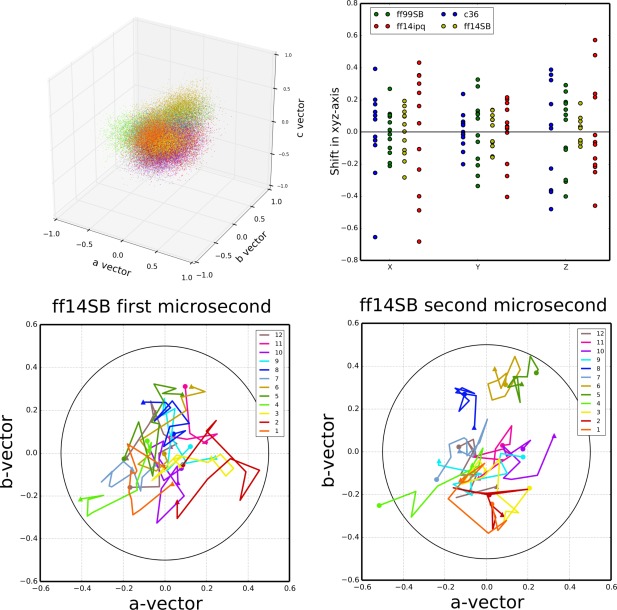
Figure 7.

ASU center of mass movement relative to ideal crystal lattice positions. Upper‐left: cumulative plot of the center of mass of each ASU relative to the ideal lattice position at each time point in the simulation. Points are colored by each independent copy of the ASU in the system (12 independent ASUs). ff14SB is shown, data for the other simulations can be found in the Supporting Information. Upper‐right: mean distance of each independent ASU relative to the ideal crystal position along each of the crystal system axes (a–c). Lower‐left: mean position of each ASUs center of mass plotted over intervals of 100 ns over the course of the first microsecond of simulation. Starting position (<t = 0–100 ns>) indicated by a circle and ending position (<t = 900–1000 ns>) indicated by a triangle. Data shown for the ff14SB simulation; similar plots for the other simulations available in the Supporting Information. Lower‐right: similar plot for the second microsecond of the ff14SB simulation. A circle is drawn at 0.5 Å from the ideal center of mass in both plots.
