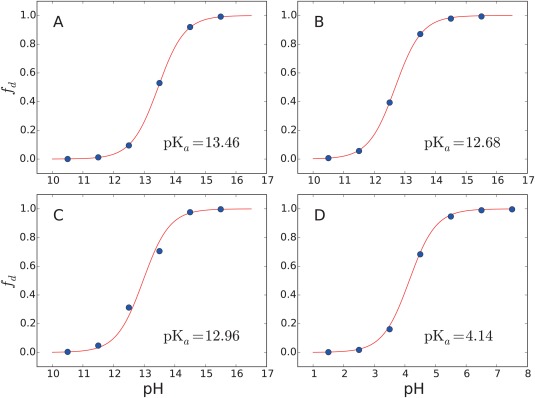
Figure 6.

Titration curves of CB[7]:BZ complexes obtained from constant‐pH simulations with three non‐bonded interaction calculation schemes: (A) cutoff, (B) PME and (C) IPS methods. Panel (D) shows the titration curve of CB[7]:BZ complex with RESP charges using the simple cutoff scheme. The x axes represent pH and the y axes represent the fraction of deprotonated BZ, f d. Solid lines represent the deprotonated fraction estimated with the Henderson‐Hasselbach equation using the estimated pK a values. Blue dots are obtained from the constant‐pH simulations.
