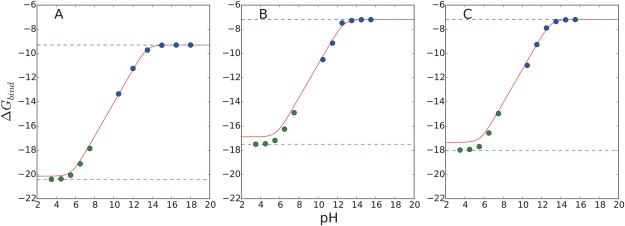
Figure 9.

pH‐dependent binding free energies of the CB[7]:BZ complex with CGenFF charges using different non‐bonded interaction calculation schemes: (A) cutoff, (B) PME, and (C) IPS. Solid lines are obtained with the analytic formula, Eq. (10), using the pK a value estimated from the constant‐pH simulation and the binding free energy calculated with the deprotonated BZ as a reference binding free energy ( ). Blue and green dotted lines correspond to the calculated absolute binding free energy values of the deprotonated and protonated BZ molecule using the VBA method [Eq. (13)]. Blue and green dots are calculated by considering the effect of multiple protonation states using the BAR calculations [Eq. (5)]. The deviations between the blue dotted lines and blue dots correspond to the values in Figure 3. The free energy values are lowered by allowing multiple protonation states. Under the high pH conditions, the free BZ molecule is assumed to be fully deprotonated. The deviations between the green dotted lines and the green dots correspond to values in Figure 3 corresponding to the free energy cost associated with constraining multiple protonation states to a single protonation state. Under the low pH conditions, the CB[7]:BZ complex is assumed to be fully protonated..
