Figure 2.

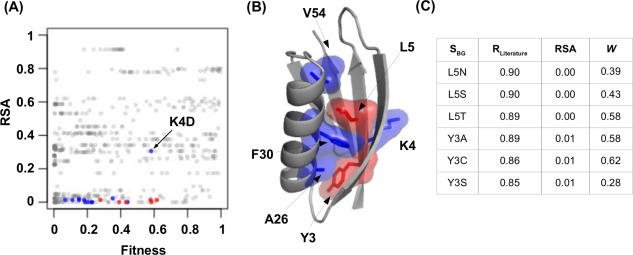
Property of S BG with a higher R Literature. (A, B) S BG with a R Literature of >0.85 are colored in red and S BG with a R Literature of >0.75 are colored in blue. (A) A two dimension scatter plot is shown with each S BG represented by a data point. The y‐axis represents the RSA and the x‐axis represents the fitness (W). The only nonburied S BG with high correlation is K4D which is labeled. (B) The spatial locations for those S BG with a R Literature of >0.75 are shown on the protein G structure (PDB: 1PGA).12 (C) The R Literature, RSA, and W are shown for those S BG with a R Literature of >0.85.
