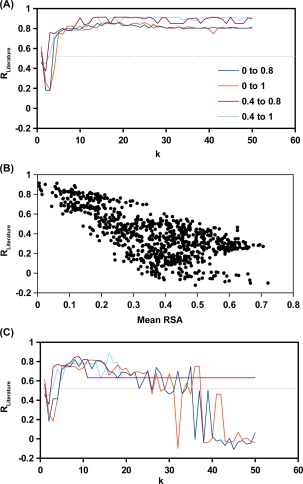
Figure 4.

Results from k‐means clustering. k‐means clustering was performed to group S BG by the similarity of G profile. For a given k selection, 100 independently runs of k‐means clustering were performed. Consequently, 100 × k groups of S BG would be obtained. This analysis was performed for S BG with a fitness within the indicated range. There were 678 S BG within a fitness range of 0–1 (orange), 249 S BG within a fitness range of 0.4–1 (cyan), 153 S BG within a fitness range of 0.4–0.8 (brown), 582 S BG within a fitness range of 0–0.8 (blue). (A) The R Literature was computed for the S BG group with the lowest mean RSA. (B) The relationship between mean RSA and R Literature for the S BG groups produced from 100 runs of k‐means clustering with k = 18 and an S BG fitness range between 0.4 and 0.8. (C) The R Literature was computed for the S BG group with the lowest mean hydrophobic score of the WT amino acids of S BG. The gray‐dotted line represents the R Literature from G prediction using Rosetta software.13 Parameters were taken from row 16 of Table I in Kellogg et al.14
