Figure 2.

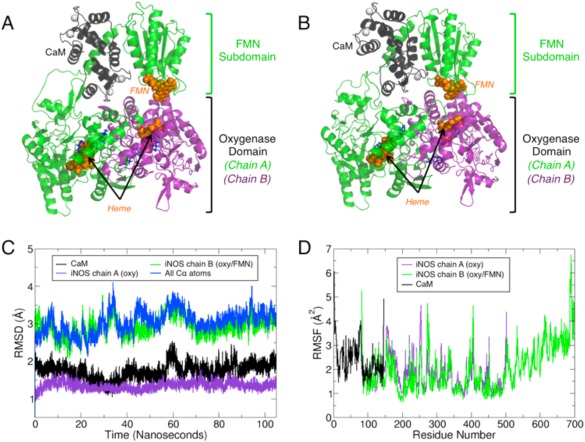
MD simulations of the oxy‐FMN‐CaM reveal complex stability. (A) The initial system for the oxy‐FMN‐CaM system, as described in the results and methods, is displayed and (B) a snapshot taken at 80 nanoseconds which represents an equilibrated complex structure. For both (A) and (B), chain A of the oxygenase domain is colored purple, chain B which includes a oxygenase domain, CaM‐binding helix and FMN subdomain is colored green, and CaM is shown in black. The heme and FMN cofactors are displayed as orange sticks, the substrate l‐Arg and H4B in blue sticks, and Ca2+ and Zn2+ as white spheres. The equilibrated CaM and FMN subdomain model is closer to chain A of the heme domain than in the initial starting model. (C) Root mean squared distance (RMSD) analysis over the full 105 nanosecond trajectory shows that the structure remains relatively unchanged over the course of the trajectory following initial minimization and initiation of the simulation for each major chain of the oxy‐FMN‐CaM. (D) Root mean square fluctuations (RMSF) measured for the sidechains for CaM (black), chain A heme domain (purple), and chain B heme/FMN domain (green).
