
Figure 3.
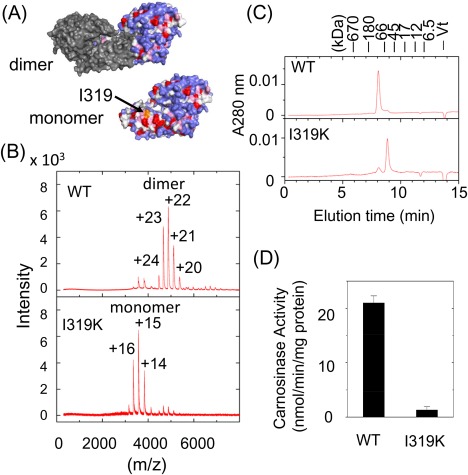
Oligomeric states and enzymatic activities of wild‐type and I319K mutant proteins of CN2. (A) Hydrophobicity of the dimer interface of CN2. The upper picture shows a CN2 dimer in which one subunit was drawn in gray, while the other subunit drawn in colors that reflect the hydrophobicity index of Kyte and Doolittle;28 red: index >3.0 (Ile, Val, Leu), magenta: index >1.5 (Phe, Cys, Met, Ala), light blue: index >−2.0 (Gly, Thr, Ser, Trp, Pro), and blue: index >3.0 (His, Glu, Gln., Asp, Asn, Lys, Arg). The lower picture shows the surface of CN2 monomer drawn in the same color. In this picture, the surface of the dimer interface is visible. The position of I319 is indicated by an arrow. (B) Mass spectrometric analysis of subunit composition of CN2. Wild‐type CN2 and I319K mutant protein were prepared in 100 mM ammonium acetate, pH 7.5, and analyzed by ESI‐TOF MS. (C) Size exclusion chromatography of wild‐type and I319K mutant proteins of CN2. Each sample was analyzed by HPLC in the same condition as described in Figure 2(D). (D) Enzymatic activities of wild‐type and I319K mutant of CN2. Activities were determined using carnosine as the substrate. Data represent mean ± SE of triplicated determinations.