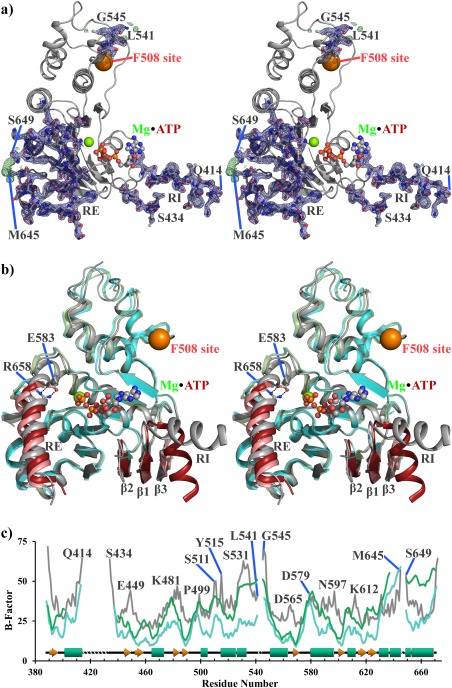
Figure 2.

A novel 3S ΔF508 NBD1 structure demonstrates plasticity of RI and RE compared with the rest of NBD1. Stereo view of the 3S ΔF508 NBD1 structure showing either (a) 2Fo‐Fc (blue, 3σ) and Fo‐Fc (green, 1.5σ) density or (b) overlay of our structure (gray) with chains A (cyan) and B (green) of 2BBS. NBD1 is oriented such that the membrane spanning domain interface would be above it, and the NBD2 binding interface is opposite into the plane of the page. The F508 site is indicated as an orange sphere. ATP•Mg2+ is labeled and shown as sticks. The current structure and 2BBS are identical constructs, which crystallized in different space groups but attained the same resolution. Modeled regions of RI and RE are well supported by density and show a significant difference in their interactions with NBD1 than previously seen for human 3S ΔF508 NBD1. (c) B‐factor analysis of the current structure (gray) and 2BBS chain A (cyan) and B (green) with model breaks labeled.
