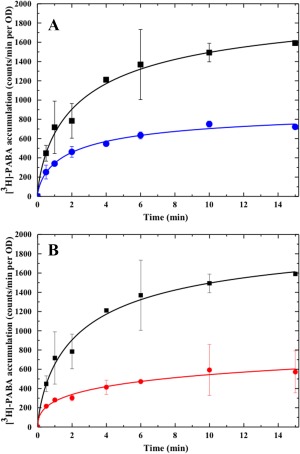
Figure 6.

Accumulation of radioactive p‐aminobenzoic acid over time in cells expressing the YdaH or MtrF transporter. (A) Time course of [3H]‐PABA accumulation by E. coli BL21(DE3)ΔabgTΔpabA double knockout cells transformed with pET15bΩydaH or pET15b. Cells expressing ydaH (blue curve) show a significant decrease in [3H]‐PABA accumulation when compared with cells carrying the empty vector (black curve). Error bars represent standard deviation (n = 3). (B) Time course of [3H]‐PABA accumulation by E. coli BL21(DE3)ΔabgTΔpabA double knockout cells transformed with pET15bΩmtrF or pET15b. Cells expressing mtrF (red curve) show a significant decrease in [3H]‐PABA accumulation when compared with cells carrying the empty vector (black curve). Error bars represent standard deviation (n = 3). The data showed in (A) and (B) are the cumulative average of three successive recordings.
