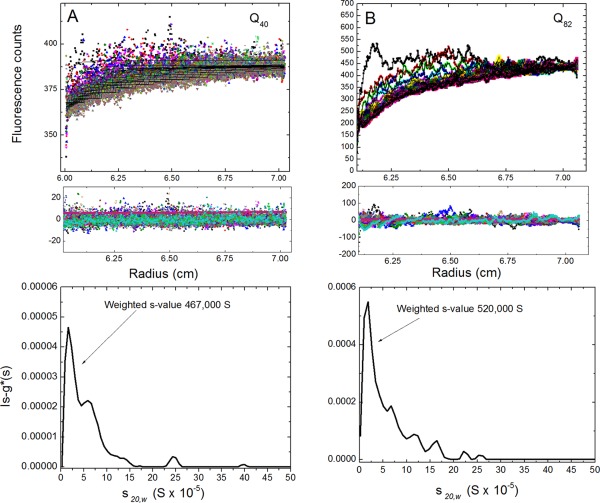
Figure 2.

Sedimentation velocity experiments containing 2 M sucrose. A: Aggregates of Q40‐YFP captured in 1x lysis buffer supplemented with 2 M sucrose and run at 3000 rpm (top graph represents raw data; middle graph shows residuals from the fits; and the bottom graph shows the ls‐g*(s) distribution). The data were fit using a ls‐g(s*) model, which is equivalent to the distribution g(s*) from dc/dt as a distribution of nondiffusing particles. B: Aggregates of Q82‐YFP captured under similar conditions as in Q40‐YFP (SV data for Q0‐YFP and Q35‐YFP samples in 2 M sucrose are shown in Supporting Information Fig. S4).
