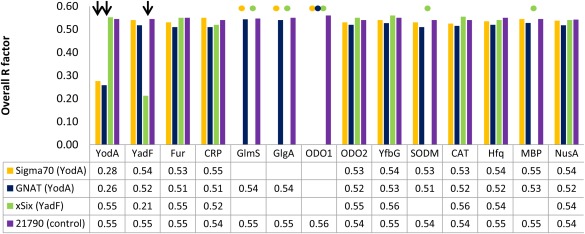
Figure 2.

Overview of MR experiments run with diffraction data collected from crystallization artifacts: Sigma70 factor (YodA), GNAT (YodA), survivin SIX or xSix (YadF), and NYSGRC‐021790 (as a negative control). The MR method was applied to each test case, using as templates selected structures of purification artifacts listed in Table S2, Supporting Information. Because the identities of the artifact proteins were known before running MR experiments, only the structures of E. coli native proteins and two selected affinity/solubility tags were used as templates. All PDB deposits listed in Table S2, Supporting Information for a given purification artifact were tested—the R‐factors reported on the figure are mean of R‐factor values of MR experiments run for each template corresponding to a given artifact. The overall R‐factors used for success‐failure determination are calculated after 15 cycles of REFMAC refinement of the best MR solution (determined by MOLREP) for each template‐dataset pair. Successful identification of an artifact is marked with arrow and a failure of MOLREP to produce a MR solution is marked with a dot. For all templates, chain A was selected for MR.
