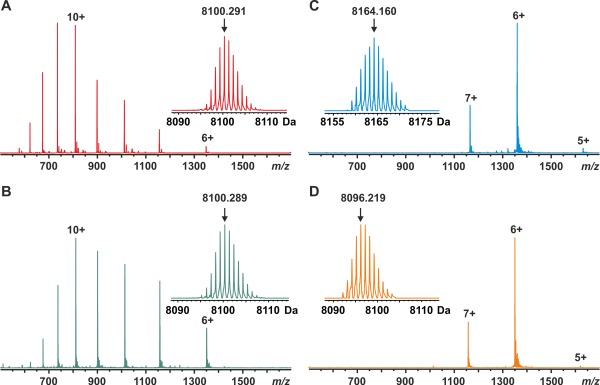
Figure 2.

ESI FT‐ICR mass spectra of SAP30L (residues 25–92) measured in (A) MeCN/H2O/HOAc (49.5:49.5:1.0, v/v), (B) 20 mM NH4OAc buffer (pH 6.8) in the presence of 1,10‐phenanthroline (100‐fold molar excess), (C) 20 mM NH4OAc buffer (pH 6.8), and (D) 20 mM NH4OAc buffer after oxidation for 10 min with hydrogen peroxide (10‐fold molar excess). The numbers denote different charge states. The protein concentration was 1 µM in (A) and 5 µM in other measurements. Insets show the deconvoluted isotopic distributions of SAP30L. The arrows denote peaks representing the most abundant isotopologues with their masses indicated.
