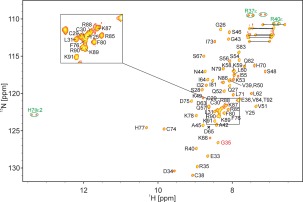
Figure 3.

Assigned 1H,15N HSQC spectrum of holo‐SAP30L. Cross peaks marked in green originate from side chain N—H groups; they appear as doublets due to insufficient decoupling power outside the backbone amide 15N region. The cross‐peak of Gly35 is aliased from the lower 15N field, 101.9 ppm. Side chain NH2 resonances of Asn and Gln residues are connected with horizontal lines.
