
Figure 3.
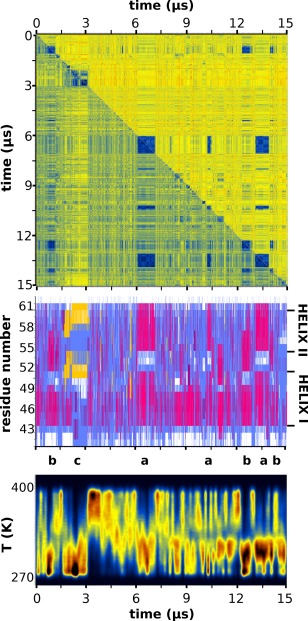
RMSD matrix, secondary structure and temperature distribution. The top panel depicts the RMSD matrix for the whole length of the trajectory in which warm colors (red, yellow) correspond to large RMSD values and cold colors (blue) to low RMSD values (similar structures). The upper half of the matrix was calculated using all non‐hydrogen atoms, the lower half only the peptide's Cα atoms. The middle panel is the STRIDE‐derived per residue secondary structure assignments with magenta depicting helical structure, yellow for β‐structure, cyan for turns, and white for random coil. Immediately below the secondary structure panel, the locations of the three most prominent peptide conformations (denoted as “a,” “b,” and “c”) along the extent of the trajectory have been marked. The lowest panel shows the distribution of the adaptive tempering temperature as a function of simulation time (notice the one‐to‐one correspondence between major conformers and low temperatures). See The Peptide is Mostly Disordered, but with Persistent Secondary Structure section for a detailed discussion of this figure.