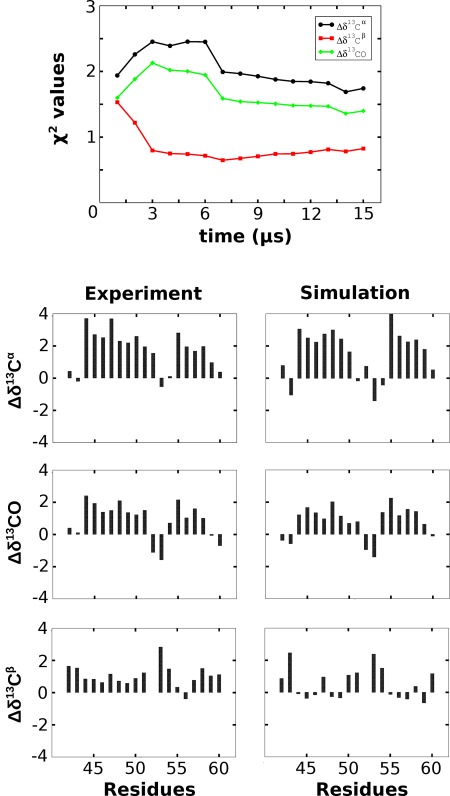
Figure 5.

Comparison between chemical shifts. The upper panel shows the evolution of the reduced χ 2 values for the Δδ13Cα, Δδ13CO, and Δδ13Cβ secondary shifts as a function of simulation time. The lower three panels are a direct per‐residue comparison between the experimental (left row of diagrams) and simulation‐derived (right row) secondary shifts from the major peptide conformer in units of p.p.m. See The Simulation‐derived Chemical Shifts are in Reasonable Agreement with the Experiment section for a detailed discussion of this figure.
